With ESA's Copernicus Sentinel-5 Precursor (S-5P) satellite, it is now possible to access near-real time data pertaining to Trace Gases and Atmospheric Pollution for virtually any region of our planet. Learning about it from University of Luxembourg's MOOC, I am in awe with this ambitious and abundantly useful Copernicus Earth Observation Programme.
While the Covid-19 related Nationwide lockdown is unfortunate, it presented a suitable opportunity for me to use Copernicus' data to visualize and compare the changes in Air Pollution levels in India on a Year-on-Year basis. I had hypothesized that there would be a significant dip in Air Pollution due to lack of economic activity arising from the imposed lockdown. After all, I had read news reports which indicated the possibility - residents of Jalandhar being able to view the Himalayan Range from their terraces as well as clear blue skies greeting residents of New Delhi (a rare occurence both of them).
Below is the map-based final output for for Tropospheric Nitrogen Dioxide (NO2) Vertical Column Density (VCD) levels. I've compared the data captured on April 2020 with that of April 2019.
NO2 is a major & harmful air pollutant - Burning of Fuel, be it from power plants or from vehicles, is its common source of emission and thus, it is a predominantly man-induced pollutant.
I have used Sentinel-5P L2 Offline product and the scale is from a minimum of 0 NO2 molecules per centimeter square to a maximum of 4.52*10^15 NO2 molecules per centimeter square.

Below are some of my observations:
- There has been a considerable drop in NO2 levels, the biggest benefactor being North India followed by West India.
- NO2 levels in South India has reduced considerably as well.
- However, East India (excluding the North-East as it was not a part of the current imagery extent) still has numerous NO2 hotspots, albeit with a lower intensity than the year prior. These can be attributed to the continuing operations in Mining and allied industries. Being part of the essentials supply chain, these industries continue to remain operational despite the Nationwide lockdown. Nonetheless, the quantum of economic activity has reduced even in these zones, resulting in lower Air Pollution levels in 2020.
- The Pollution hotspots are a cause of concern though, given the looming Climate crisis. What measures do you think Individuals or Organizations should adopt to lower their NO2 emissions?
- Notice the few hotspots near the coastline of the state of Gujarat (West India). I think these can be attributed to the operations of the world's largest Petroleum Refinery in Jamnagar and allied industries in its vicinity.
- Also, notice the tiny hot spot on the West Coast of Sri Lanka. It is exactly over Colombo - where the industrial and economic hub of the country is located.
The Satellite Imagery dataset has so much to reveal. What else could you infer?
Please note that the dataset is not depicting Surface level NO2 commonly measured in 'ppm' (parts per million). Instead, it is depicting the NO2 levels higher up in the atmosphere - 'the troposphere' - factors such as Wind speed and Temperature can affect the concentration and spread of the gas from the surface. As a result, it would be incorrect to interpret that the source of all the NO2 hot spots is directly underneath.
Apart from Nitrogen Dioxide, the TROPOMI instrument on-board Sentinel-5P captures pollution data related to Sulphur Dioxide, Ozone, Aerosols, Carbon Monoxide, Methane among other trace gases. Which one would you like to measure and why?
As you would concur, Mapping is a useful medium to analyse and depict vast quantities of geodata. Just imagine being given a spreadsheet instead - with NO2 levels given for each pixel. It would be difficult to comprehend much from it.
ABOUT US
Intelloc Mapping Services | Mapmyops.com is based in Kolkata, India and engages in providing Mapping solutions that can be integrated with Operations Planning, Design and Audit workflows. These include but are not limited to - Drone Services, Subsurface Mapping Services, Location Analytics & App Development, Supply Chain Services, Remote Sensing Services and Wastewater Treatment The services can be rendered pan-India, some even globally, and will aid an organization to meet its stated objectives especially pertaining to Operational Excellence, Cost Reduction, Sustainability and Growth.
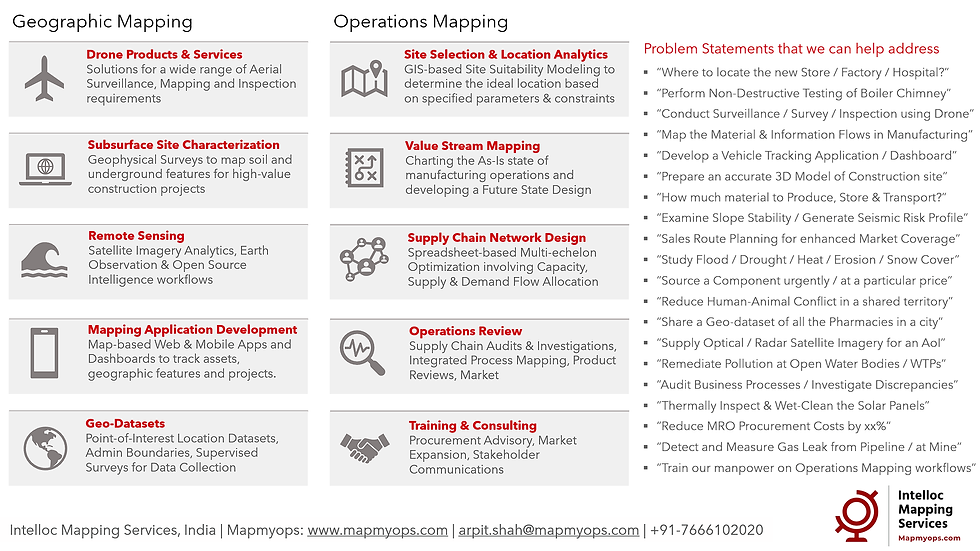
Broadly, our area of expertise can be split into two categories - Geographic Mapping and Operations Mapping. The Infographic below highlights our capabilities.

Our 'Mapping for Operations'-themed workflow demonstrations can be accessed from the firm's Website / YouTube Channel and an overview can be obtained from this flyer. Happy to address queries and respond to documented requirements. Custom Demonstration, Training & Trials are facilitated only on a paid-basis. Looking forward to being of service.
Regards,

