Remember the Thailand Cave stranding incident of 2018? It was such a delicate situation and the Rescue operations caught the attention and admiration of people across the world. Mapping played a crucial role in it-

Incredible, isn't it?
I was exposed to the concept of 'Fully Flexible' Supply Chain, developed by thought leader Dr. John Gattorna, during an internship at his Advisory and I have grown to admire this form of Supply Chain behavior (Get his book here). Essentially, Fully Flexible Supply Chains (or Supply Chain Behaviour) are extraordinarily resilient & proactive during times of crisis. Having revisited my Literature Review document compiled for the internship project now, it strikes to me that Mapping plays a vital role in enhancing the prowess of such Supply Chains.
Excerpt from the document:
'Revilla and Saenz (2014) have studied in depth the emergency supply chains of Cisco. The
company has understood and planned for risks arising out of natural disasters and improved its
resilience over time. It has learnt to “integrate supply chain design and supply chain risk
management, balancing proactive mitigation capabilities in order to keep the company’s supply
chain as resilient, efficient and profitable as possible” (p. 23). When Hurricane Katrina struck in
2005, Cisco executives created a ‘business continuity planning dashboard to mitigate risks’ (p.
23). The system was reactive, however, and it could not maintain the necessary supply chain
performance levels. A surge in orders of nearly $1bn worth of new equipment to replace
telecommunications infrastructure was not fulfilled as company executives could not locate all
its products in the supply chain or assess the financial impact of emergency sales. This led the
company to introspect and make their supply chain extremely flexible in case such a situation
arose in the future.
And so it did. The Japanese earthquake and tsunami in 2010 had caused economic losses to world supply chains of an estimated $217bn. However, Cisco assessed the situation and suffered almost no revenue loss. It took just 12 hours for Cisco’s risk managers to identify all of the suppliers in the region and to assess the impact of disaster. The risk rating was assigned to each part and all the information was charted. On the same day managers were positioned to communicate with
customers and raised 118 enquiries. (p.24) As per the authors, Cisco had identified strategic
priorities, mapped the vulnerabilities of supply chain design, integrated risk awareness into the
product and the value chain, monitored resiliency and kept a watch for events all of which
exhibited characteristics of a fully flexible supply chain.'
If you were to browse through any Literature on how organizations have responded during times of crisis, you'll be certain to find instances of the word 'mapping', 'charting', or its variants.
It is important to know that Mapping has evolved from being just a medium of Visual Depiction to being a Dynamic System to store, explore and query Geographic Information - a GIS. Moreover, with the evolution of computing: AI, ML and IOT technologies can be integrated with GIS to generate superior Location Intelligence and insights to help an organization manage High-Risk situations much better.
Visit my website's home page to explore several GIS-based posts containing demonstrations on how Mapping helps to plan, visualize and monitor business operations during times of crisis.
ABOUT US
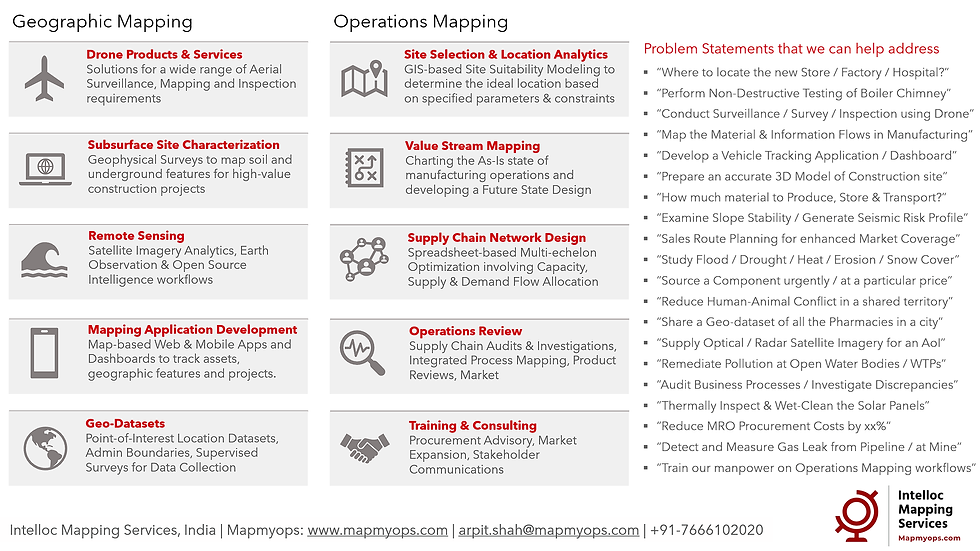
Intelloc Mapping Services | Mapmyops.com is based in Kolkata, India and engages in providing Mapping solutions that can be integrated with Operations Planning, Design and Audit workflows. These include but are not limited to - Drone Services, Subsurface Mapping Services, Location Analytics & App Development, Supply Chain Services, Remote Sensing Services and Wastewater Treatment. The services can be rendered pan-India, some even globally, and will aid an organization to meet its stated objectives especially pertaining to Operational Excellence, Cost Reduction, Sustainability and Growth.
Broadly, our area of expertise can be split into two categories - Geographic Mapping and Operations Mapping. The Infographic below highlights our capabilities.

Our 'Mapping for Operations'-themed workflow demonstrations can be accessed from the firm's Website / YouTube Channel and an overview can be obtained from this flyer. Happy to address queries and respond to documented requirements. Custom Demonstration, Training & Trials are facilitated only on a paid-basis. Looking forward to being of service.
Regards,

