

Location Analytics for sharper Law Enforcement
- Arpit Shah

- Oct 2, 2021
- 6 min read
Updated: Mar 27
There is a certain charm in solving a case involving crime - from inspecting the incident site and investigating the suspects to uncovering the motive and identifying the culprit. People of all ages tend to enjoy the unraveling of mystery in novels and in movies. While the content tends to be fictional, the addition of ...based on a true story increases the thrill-quotient by several notches.
What if such a story is narrated by the real-life protagonist? Wouldn't that be doubly fascinating? If your answer is in the affirmative, you are likely to enjoy this TEDx Talk by IPS Amit Lodha-
All crimes, with the exception of Cyber, occur at a physical location(s). And anything that involves positional information can always be mapped - which aids in analysis and reveals interesting insights. Modern Mapping technology - Geographic Information System or GIS is widely used for several Law Enforcement Workflows - four of which I will demonstrate in this post.
HYPERLINKS TO SECTIONS
1. Coverage Mapping of Police Stations to ensure Rapid Response
GIS-based Location Analytics helps Law Enforcement agencies to plot and interpret historical Crime data and make informed decisions about resource allocation. The map below depicts all recorded Crime locations and Police Station locations in a city comprising five districts over a period of time-

Using geoprocessing tools within the online GIS online software, I have prepared a map (Figure 2 below) which depicts those zones in the city that are within rapid reach of the Police Station network - the pink-shaded areas are reachable within 5 minutes of driving from a Police Station. While the location analytics takes into account the road network in the city, vehicle traffic can also be integrated in the Drive Time Areas computation if the dataset is available.

This helps me to know that 922 out of the 1025 historical Crime sites (black dots) are located within the 5-minute Drive Time zone which implies that the rapid coverage zone of Police Stations is ~90% (assuming historical crime spots are a good proxy for future crime spots). That being said, you will observe that several areas within Lincoln City limits (outlined in black) do not have rapid response coverage - that crimes have not occurred abundantly in these regions is another matter altogether.
A Heat map of the historical crime sites (Figure 3 below) helps me to identify the zones where there is a high density of crime-

Upon overlaying the Heat Map layer on the Drive Time/Rapid Response layer (Figure 4 below), one can identify the areas within Lincoln city which need immediate attention - the blue zones on the eastern fringes of Lincoln city should be prioritized for setting up new Police Stations-

One can continue refining the analysis on the GIS platform - for example, what is the minimum number of new Police Stations needed and where to set them up so as to enable maximum coverage of the underserved city fringes - Optimization and Network Modelling capabilities are integrated in Location Analytics platforms/GIS.
2. Map-based Operations Dashboard to monitor Crime
While I had not categorized crime records in the previous workflow, visualizing crime by the degree of severity would aid the analysis.
Clicking on Figure 5 below will direct you to a GIS Dashboard of Crime maintained by Yakima Police Department (USA). The Dashboard is dynamic - it allows the viewer to visualize historical Crime data across multiple categories and time-horizons. Do check it out - use the filters and navigation options to explore this interactive Map-based Application for Law Enforcement-


As depicted in Figure 6, one can even integrate Live Video feeds to such Dashboards - be it from CCTV, Drones or other surveillance devices. This enhances the utility of the Dashboard Application by several notches.
For decision makers within Law enforcement, GIS not only helps in understanding historical crime but also assists in monitoring real-time policing operations as well as anticipating future scenarios.
3. Innocuous Medical Prescriptions or a Deadly Drug-Trafficking Ring?
Unearthing a Drug-trafficking ring by analyzing hundreds of innocuous Medical Prescriptions - if this sounds interesting to you, you will definitely appreciate the video below which demonstrates how advanced Location Analytics modules help Law Enforcement to detect sophisticated Crime-
The geoprocessing was performed using an advanced Location Analytics module - ArcGIS Insights
4. Analyzing Cell Tower Records to isolate Suspects
IPS Amit Lodha (Police) highlighted in his TEDx Talk how he monitored the criminal's phone location to triangulate and nab him. Now imagine a scenario where Law Enforcement is not aware of who the criminal is and thus, have to sift through plenty of telecom records in a bid to detect patterns and shortlist potential suspects. GIS platforms are robust in that they can handle an extraordinary amount of data. The map in Figure 7 below depicts 1.28 million cellular location records of nearly 2500 mobile phone users over a period of 45 days obtained from Telecom Towers.
Law Enforcement is of the opinion that the Crime syndicate is operating from 3 Zones in the city (denoted by violet boxes) and now they can proceed to identify those individuals who have visited all these three areas within the last 45-days-


Being able to accomodate vast quantity of data notwithstanding, you may feel it would be an arduous challenge for the GIS software to navigate the Telecom records in a bid to detect meaningful patterns that would lead Law Enforcement to the criminals.
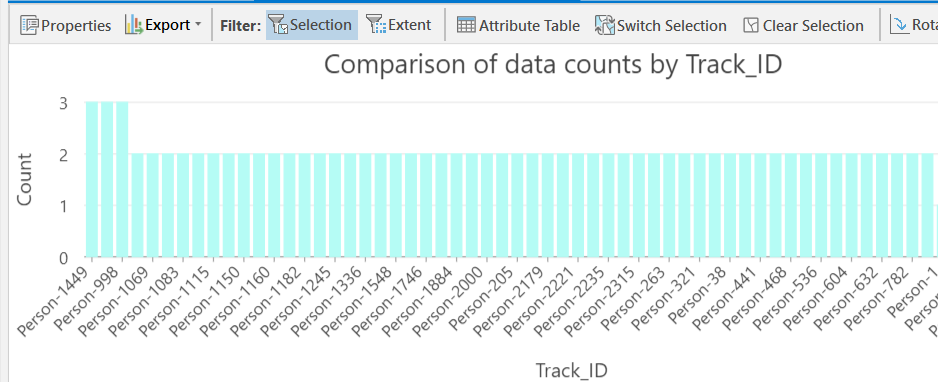
As I'll demonstrate below, there are unique ways to filter out less important data and emphasize the vital parameters. Figure 9 below displays a Chart developed within the desktop GIS software itself which depicts statistics of those Cell Phone users who have traveled to two or more of the three suspected Crime Zones within the last 45 days -

Law Enforcement wishes to study the movement of three individuals in particular and have used a geoprocessing tool - Select by Attributes (see Figure 10) to hone in on them.

Furthermore, and more importantly, Law Enforcement will now sift the spatial data through time.
See this demonstration-
While Positional data itself is useful to perform meaningful analytics on a GIS platform - analyzing this data temporally is even more insightful. Spatiotemporal Analysis is a level-up on Spatial Analysis - as evident in this post of mine involving the analysis of Vehicle Accident records to detect Road Sections prone to Safety risks.
CONCLUSION
Because Location Analytics for Crime is a niche field, certain geoprocessing tools have been custom-built for the practitioners and are bundled as an add-on module in a GIS package. Explore a StoryMap of one such module by clicking on Figure 12 below-

You have seen how GIS allows Law Enforcement to perform geospatial analytics to track and prevent crime. See this interesting video on how Location Intelligence is being leveraged to enhance situational awareness in order to to manage incidents at a racing event-
Reach out to us with your Location Analytics requirements.
ABOUT US
Intelloc Mapping Services, Kolkata | Mapmyops.com offers Mapping services that can be integrated with Operations Planning, Design and Audit workflows. These include but are not limited to Drone Services, Subsurface Mapping Services, Location Analytics & App Development, Supply Chain Services, Remote Sensing Services and Wastewater Treatment. The services can be rendered pan-India and will aid your organization to meet its stated objectives pertaining to Operational Excellence, Sustainability and Growth.
Broadly, the firm's area of expertise can be split into two categories - Geographic Mapping and Operations Mapping. The Infographic below highlights our capabilities-

Our Mapping for Operations-themed workflow demonstrations can be accessed from the firm's Website / YouTube Channel and an overview can be obtained from this brochure. Happy to address queries and respond to documented requirements. Custom Demonstration, Training & Trials are facilitated only on a paid-basis. Looking forward to being of service.
Regards,


